Natural
Ingridients
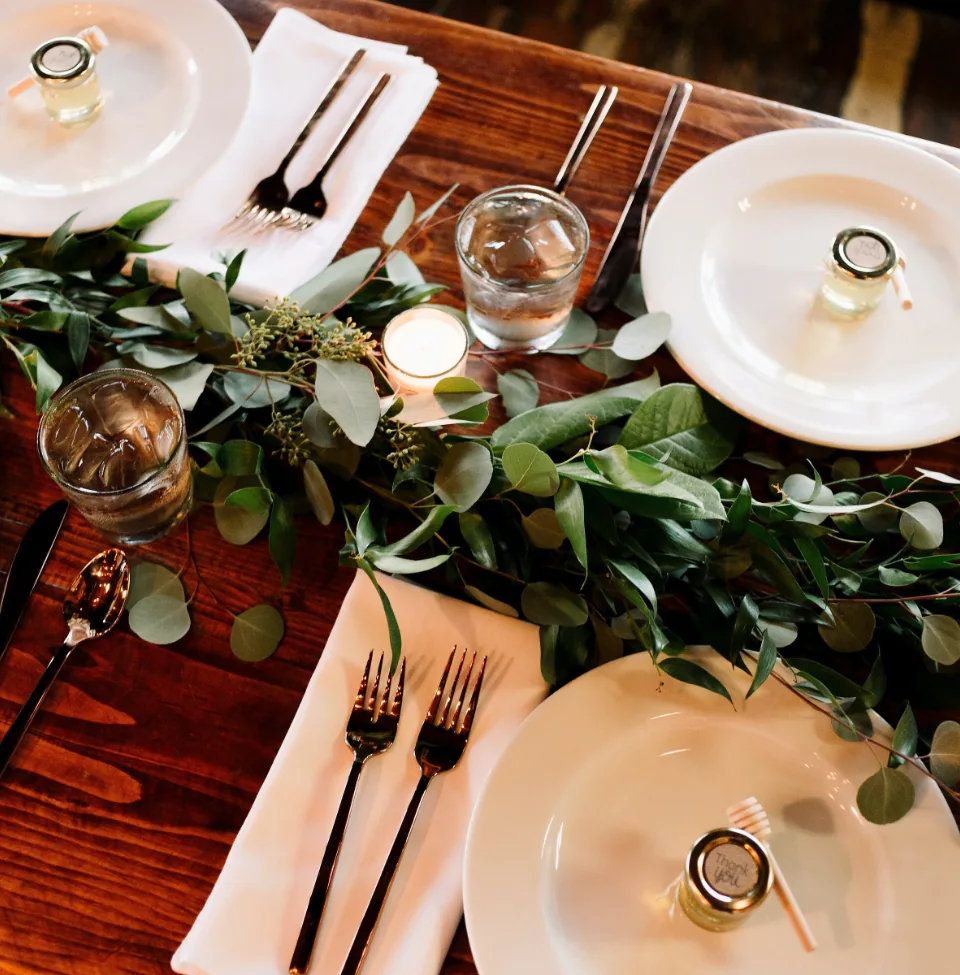
We only use the most carefully sourced ingredients, local and naturally grown where possible.
We have a sample menu on the site, but upon your booking being accepted, we have over 200+ menus to choose from.
Best
chefs
All our chefs are either experienced in restaurants at the highest level or previous Michelin star holders.
At You Must Love Food, we offer a wide variety of different food choices on our exclusive menus.
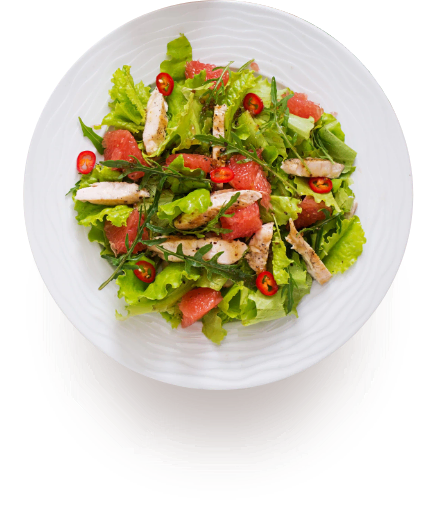
Salads
Freshly tossed salads, right in front of your guests.
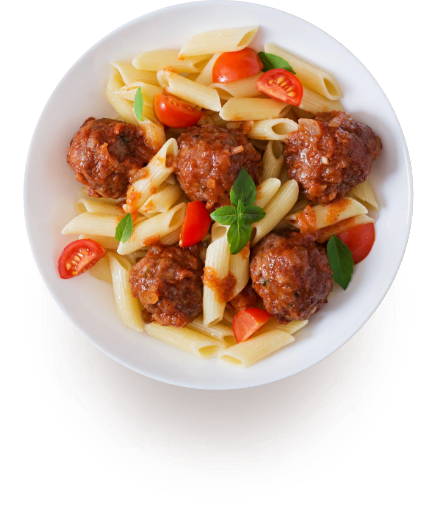
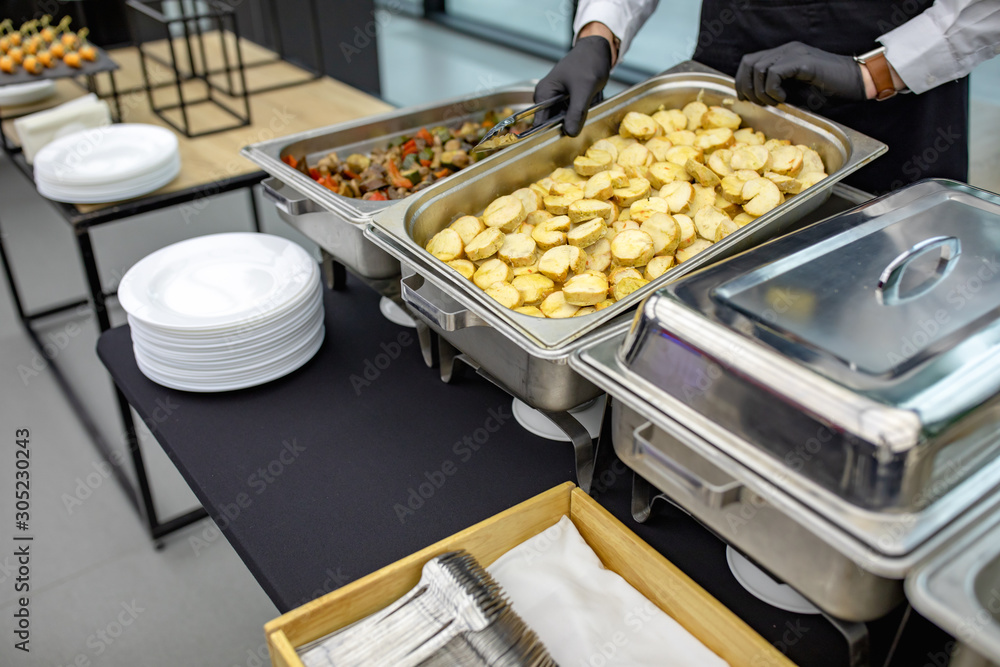
Fish & Meat
We can prepare and cook in front of you and your guests.
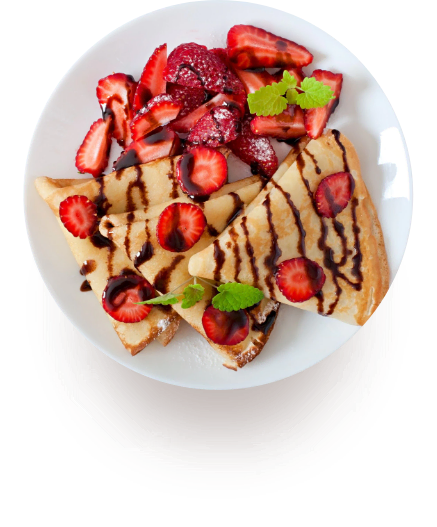
Desserts
The most luxurious desserts that everyone will be in awe of.
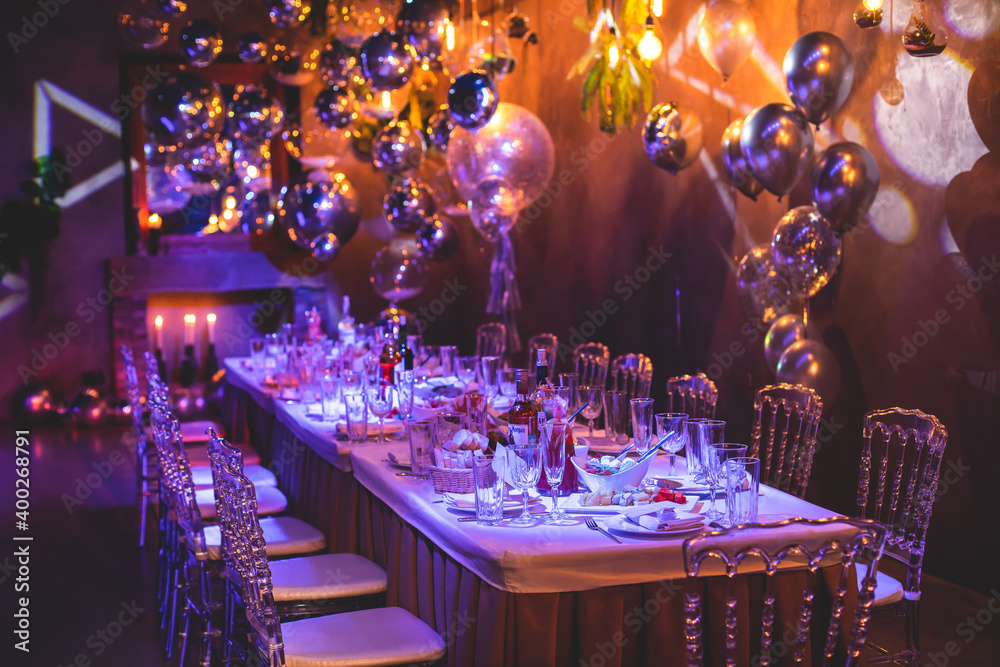
Catering for any occasion
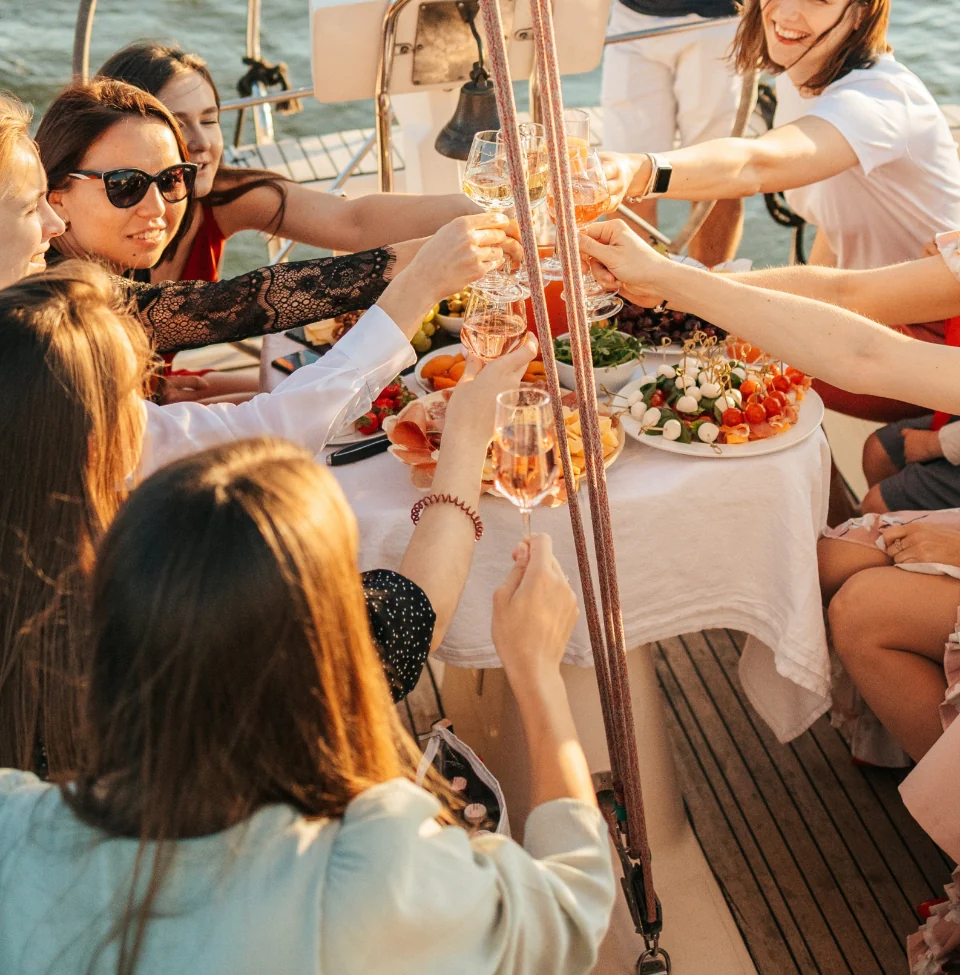
Private Party
Wedding Recepction
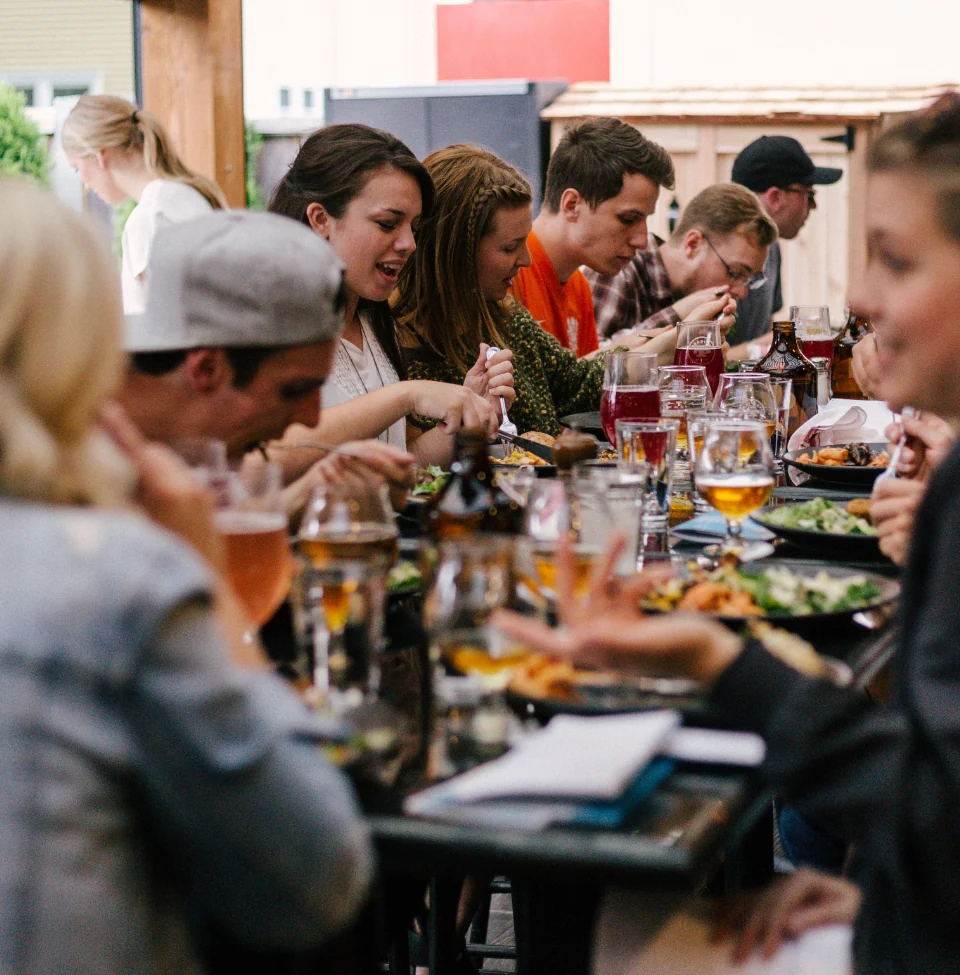
Corporate Event